Inclr: The future of visual information management is circular
Bledi Ismaili
December 27, 2021
Inclr is a new visual mapping tool that utilizes a unique interface and set of principles to manage large, complex sets of information. Its design and functionality borrows heavily from architectural concepts and uses circles as its central organizing principle.
I recently interviewed Inclr founder and developer Ken Chan to learn more about this fascinating new tool – what it’s capable of and the thinking behind it.
Chuck Frey: What inspired you to create Inclr?
Ken Chan: I’ve been a mind mapper for a very long time before I invented Inclr. I once used a mind map to diagram all the complex clauses and effects within a building contract for my architectural studies. The outcome of that and other mind map exercises was fruitful but inescapably messy. The exercise of creating relationships between nodes and ideas helps the brain remember things via muscle memory and visuals.
But I thought that mind maps, as they currently stood, felt too rigid. A complex, messy mind map led me to a feeling that was similar to information overload, adversely affecting my productivity. So I felt deep yearning for a much larger, less rigid tool for organizing my life – something that I would feel comfortable living with every day.
I came up with an idea many years ago called cluster, which became the precursor to Inclr. Inclr stands for Information cluster. This early idea was based on a visualized, networked second brain using AI to calculate distances between word semantics. This was before machine learning became popular, so the difficulties of executing this idea were significant. It also involved creating an algorithmic “black box.”
My belief is that the end goal for mind maps should be to create better mental maps, which black boxes don’t do. This is the same reason I didn’t like The Brain. While the connections to nodes seemed fluid, they would disappear and reappear, preventing you from seeing the whole picture. I felt this was in sharp contrast to experiencing architecture, where you formulate a mental map as you go from space to space.
Many years later, I was tinkering with code for a design news app, where I included a circular navigational menu. The architectural side of me saw more than just a radial dial. I saw a home, a circle enclosure that encapsulated life. As a network, it stitched the information it contained into a vibrant digital city. I called these circles inclrs, or information clusters.
I theorized that perhaps the problem with mind maps was that either each node is too simplistic, or mind maps didm’t visualize nesting very well. If each inclr was a node, it could act like an interactive widget, a bit like a mini-app, in which you could program all sorts of actions. When these inclrs were connected as a network, they could provide much deeper and richer experience of mind mapping.
Frey: How have the principles and practices of architecture influenced Inclr’s development?
Chan: There are many principles, some subtle and others more apparent, that I’ve incorporated from architecture into Inclr. The idea is that each circle is like a home or a bookshelf, something seemingly physical you can relate to, but without resorting to skeuomorphism (exact UI replicas like the timber bookshelf for Apple’s iBooks in the first iOS operating system for the iPhone). Visual structure can be felt when it makes sense, much like graphic designers create structure on paper. The more complex the connections and dataset, the more concepts governing the visual structure there should be.
One of the issues I find with today’s UX/UI is that they borrowed a lot of concepts from graphics designers, like alignment and translucency, but they don’t go further conceptually, even when the dataset for apps far exceed any page in a magazine. Developers rely on page swaps, side menus and tabs to navigate without giving second thought to what mental map it creates.
Further, UI elements flash in and out, disappearing abruptly, which reinforces the idea that the design is subservient to function. In architecture, much of its richness comes from the interplay of Form follows Function versus Function follows Form. So with Inclr, permanence – how a design element retains its position with relation to its function – is important. Design elements can stay where they are regardless of their immediate function.
Each design element contributes to an overall experience and to data cognition, so each element is in fact multi-functional. Nodes and inclrs don’t just disappear, they slide behind or remain visible at the edge of the screen. Filmmakers call this off-screen space – the idea that viewers and users can still understand a scene even when parts of the scene aren’t within the camera frame. So overall, Inclr is designed and envisioned as architectural space.
There are other concepts, too. Frank Lloyd Wright believed horizontality is more natural than verticality, so horizontality is employed in Inclr where the user experiences of data is paramount. The concept of place-making in architecture involves creating a meaningful place out of raw space, and this is apparent in the customizable graphics of each inclr or node, and the way they group together to form unique graphical clusters.
The experience of architecture involves both short and long term memory and the same happens in Inclr. We believe that the way data is presented and visualized affects the cognition of that data and changes the way it’s consumed and stored in long-term memory.
One final idea I’d like to mention is an example I’ve used to explain Inclr in the past: You remember where everything is in your home, every book and utensil, but you forget where you saved a file last night. The reason is that data is designed poorly when presented as files and folders in lists and grids. They don’t provide enough stimuli or emotive cues to trigger memory recall. With Inclr, you don’t have to try to remember or rely on a search bar, even though we provide one. Every inclr is a unique graphical impression which sits nicely in your head and heart, easily and effortlessly recalled to your mind.
Frey: What needs weren’t being met by existing visual thinking tools that convinced you that you needed to create Inclr?
Chan: There aren’t enough tools that explore the glue that holds everything together – the glue that helps make sense of the world through mental imagery, in relation to personal or business information management. The way we organize data relies on tree hierarchies and links. But drawing from other fields, you can see a plethora of organizational solutions that the tech world seemingly isn’t interesting in, or isn’t aware of.
Currently mind mapping systems and even backlinking productivity tools like Roam still predominantly use some form of tree hierarchy to organize and visualize data. Apart from color and icons, most nodes, folders or files look very much alike. Links, tags and search engines are then added to provide more fluid connections, to make up for the otherwise highly rigid structure. It feels like a convoluted set up that heavily relies on the user to draw their own mental map supplemented by a search engine when the mental map fails.
Wouldn’t it be better to have both? A better mental map and a search engine? Even when connections are visualized in mind mapping software, these links are overly simplistic when compared to the actual value of that connection. There isn’t enough design complexity in these visual structures to represent the complexity of real life.
Our brains have no problems remembering complex song lyrics, stories from hundreds of novels and movies, or massive spatial experiences they have visited. We just don’t link remembering to tree hierarchies. And nobody remembers text links. We remember colors, emotions, stories. So I think a lot of this is missing or could be improved in information management and visual thinking tools
In architecture, spatial structure is multi-dimensional and evolves with changes in time, weather, function and mood. So when I think of the current state of mind maps and networked thought, I think we are only scratching the surface of what can be done with how we experience our data.
Folders, files and nodes can be made into places where want to hang out. We just need to design them better. Design helps us to consume and retain data more naturally, rather than force feed it to us with text. With the advent of mixed reality soon becoming ubiquitous, this kind of thinking is becoming, in my mind, much more urgent and pressing. I don’t feel the tech world is equipped to further enhance our relationship with data, let alone when mixed with physical reality, where much of our visual and spatial intelligence lives. We need to merge ideas from other fields which are better versed with experiential design so that data and reality can better converse into a new mediated reality.
Frey: How does Inclr represent a new model for structuring and representing data, compared to traditional trees and lists?
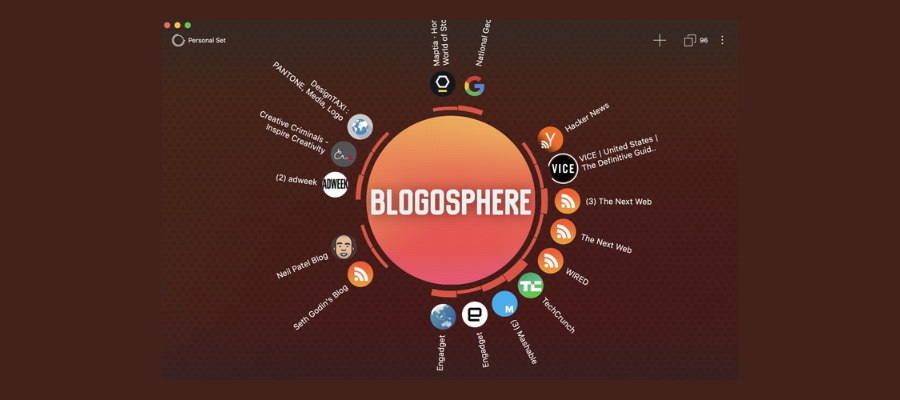
Chan: Inclr isn’t getting rid of trees or lists. In fact, Inclr is still based on a tree hierarchy. What Inclr does is add more pathways to connect ideas rather than relying only on trees and lists. In a typical software, nodes in a list or a tree are positioned in an index where the first and last nodes are the fartherest apart. With Inclr, the first and last nodes are actually the closest together because they’re arranged in a circle. Inclr creates more ways to connect ideas simply by changing the way the indexed list is presented.
Inclr considers each node to be a place where simple to complex activities can happen. An inclr can contain 1 node, or 1000 nodes, all represented within the same screen space. A single inclr could represent a whole team collaborating with hundreds of data points, or it could contain your grocery list. Each inclr is interactive, intimately tuned to the natural rotation of your thumb. The middle of the circle allows for an area to display graphics and actions, providing an opportunity for emotive stimuli. So each inclr is made to be a place to inhabit, not just some boring node.
When networked together, a rich experience of complex thought is created that doesn’t look overly complex. Compared to typical mind map trees, even simple ideas take up a lot of space. This creates a new, more appropriate model for building digital cities, cyberspace or metaverses, where datasets become infinitely complex.
Frey: What is contained in an Inclr cluster?
Chan: Each inclr is a topic which contains layers, nodes and entries. Each layer is represented as concentric circles. Nodes are contained within layers and are visualized as small circles surrounding the middle circle. Within nodes are entries. Entries can contain other entries and so on.
Each node can contain both static and dynamic content. Static content includes notes, tasks, calendar events, contacts, documents, albums, images and videos. Dynamic content includes web and map browser sessions, RSS and podcast readers, Apple Music and shortcuts. Each piece of content, which are called entries, contain capabilities that are appropriate for that feature. For example, web browser entries have their own history and bookmarks, Maps have search and pin lists, lists contain reminders and templates and notes have markdown support. RSS and podcasts have read later features. Albums can be made from custom images or bookmarked from photos.
As mentioned, entries also supports nesting. Lists can contain contain other entries. You can add contacts or web browser entries inside a map as a pin. We are working to create backlinking features so that you can add entries into notes and sketches and visualize them in the mind map, world map, 3D or AR view modes.
Frey: What role do circles play as an organizing principle of Inclr maps?
Chan: Circles help create more pathways to connect ideas and they feel more natural to our senses than squares or rectangles. They help simplify complex mind maps to fewer nodes. And overall they feel more like a mini-app, with its own interface and features, as compared to a list or a tree.
Circles are one-dimensional structures in that they have a center and a radius. Scaling a circle is superior to squares and rectangles because you simply just scale the radius. So when we talk about the permanence of ideas, a circle can do a better job because you can retain its overall look no matter how big or small it is.
Circles also help simplify things. A long list or a large tree mind map is overwhelming. But when it’s in a circle, you automatically feel calmer. In this way, circular nodes help reduce the complexity of large mind maps.
Inclrs have layers, displayed as concentric circles. They resemble a chart. To change layers you hold and swipe and the concentric circles shift all within the same circular space. This is a more elegant way to deal with nested data, compared to sub- or expandable lists which get bigger and bigger.
Manuel Lima in his “Book of Circles” highlights the uniqueness of circles in data visualization. While his diagrams showcase individual use cases, Inclr takes the principles of circles and treats them as nodes in a network.
It has to be noted that whle Inclr started with a circle, we don’t necessarily intend to stop at a circle. Each inclr can be represented in more ways than just circles. We don’t want to reveal too much but our patent covers any manifestation of structured data and nodes. We may even make each inclr into mini-expandable mind maps.
Frey: How, specifically, does Inclr help users make sense of and take action on their ideas?
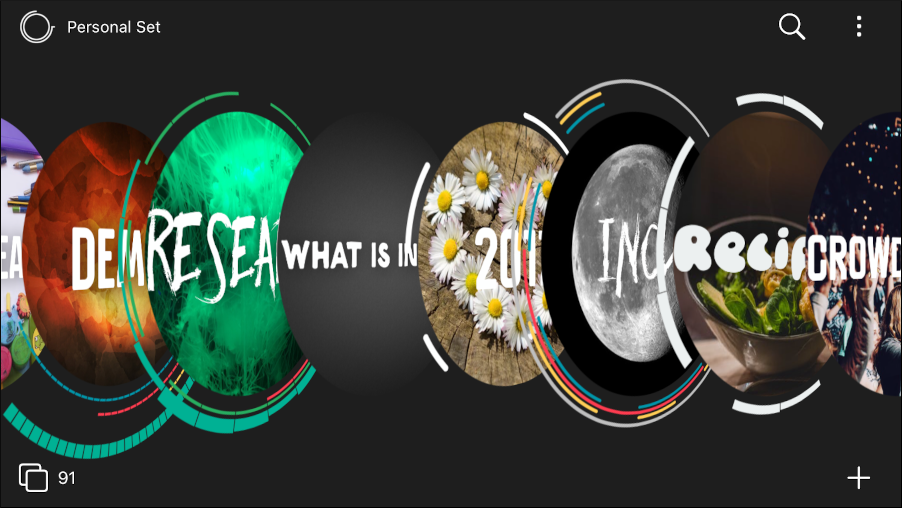
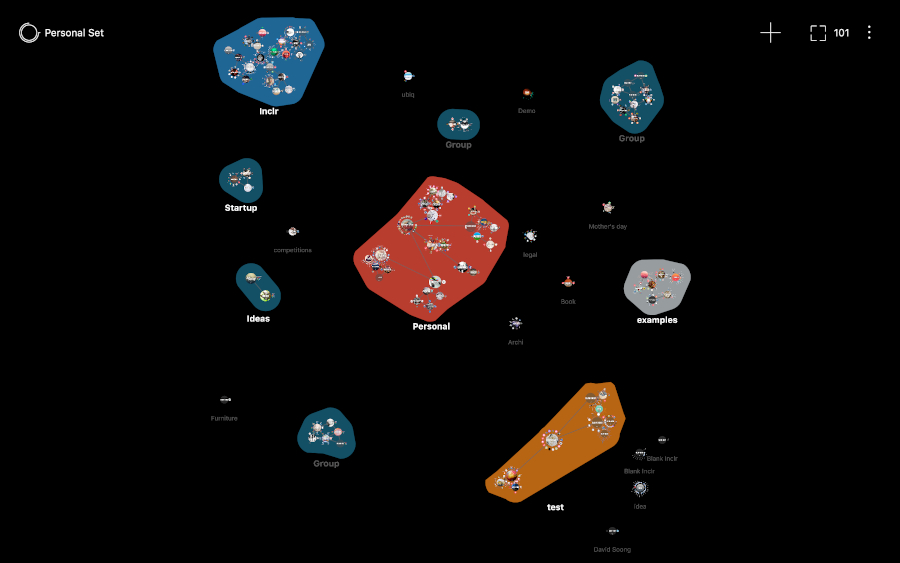
Chan: The first thing a user does using Inclr is to find their inclr. Inclrs are graphically unique so users aren’t trawling through a list or tree looking for text; they are looking for color, structure, layers and nodes. For complex mind maps, inclrs can still be recognized even when zoomed out as a small dot.
Once you zoom into an inclr, the configuration of nodes surrounding the circle help guide the structure of thoughts. They are ordered but they also feel uniformly equal. Each node can be customized to highlight importance and layers can be represented as a chart based on node content or the most read nodes. At each step, Inclr visually guides you through a journey to your designated content.
The fact that Inclr helps create mental maps means that even when not using the app, a user can typically recall where their inclrs are and how they are mind mapped together.
Frey: How is it possible to present an Inclr map as slides?
Chan: Inclr has slideshow features that allows any entry to be displayed full screen as a slideshow. Because Inclr supports both static and dynamic content, it even allows websites and map browser sessions to be presented as a slide. More enhanced features as well as slide cards and custom sequence lists are coming soon. These will allow better control of presentations and allow users to customize their story. Users will be able to present interactive slideshows in 3D and AR or on a world map, with custom sequences with dynamic animations.
Frey: What are the main use cases for Inclr? What are people creating with it?
Chan: Users are creating their second brains with Inclr, collating their research, as a daily note-taker and organizing their life, using Inclr as a hub. The most used view mode is the list mode, which allows for simplistic life and research organization. The mind map mode enables users to create a more complex and more fluid network of thoughts than other software.
There are users who love exploring how inclrs in AR can be used to create their memory mansion (useful for memorizing long sequences of information). Users also can collaborate in teams using our new sharing features, which allow participants to view or edit inclrs. Soon they will be able to publish inclrs and Inclr Spaces publicly for anyone to view their thought processes and share their second brains.
Frey: Who is your ideal user for Inclr? What types of people can benefit the most from it?
Chan: Inclr is ideal for visual thinkers and learners, and those who are looking for more fluid and open ways to organize their complex personal and business lives and thoughts. We’ve had students use it for their classes, teachers for their classrooms and executives for personal and business information management.
Our typical users have a lot of information to collate and organize. Typically, they come from using multiple apps and are looking to consolidate their information with Inclr, or are looking for more natural and intuitive ways to organize it.
Frey: What’s next for Inclr?
Chan: We are currently working on better collaboration and public sharing tools which will add the ability to share inclrs and Inclr Spaces as public and privately controlled communities. Ultimately, we are working toward the original idea of clusters, to create personal and collective intelligence, and interconnect second brains.
We will also explore chat and video chat capabilities, and expand our team collaboration toolset. Inclr Templates, better slideshow features, 3D model imports and integrating Apple shortcuts are all in the pipeline. We will also explore API integrations to connect to cloud storage, social media and other datasets.